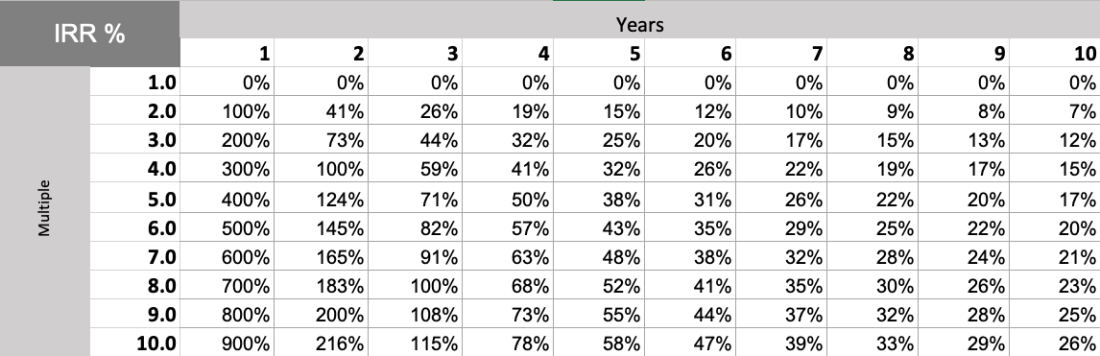
I needed a visual way to think about Internal Rate of Return (IRR) for Multiples vs Time over the lifespan of a typical fund (10 years), so put this together. It basically answers questions like: “If I double (2x) my investment in 3 years vs 10 years, what’s my IRR”? (answer 26% vs 7% – aka incredible return vs below S&P500 average).
Feel free to use.
IRR-multiplication-table (Excel file)

You must be logged in to post a comment.